Metric Tree
Metric Tree
Follow any number back to what moved it.
Follow any number back to what moved it.
Pick any metric, from net profit to gross sales from returning customers, and Cifra breaks it into the metrics underneath it. Every branch shows how much it changed, its share of the change and a plain-language explanation of what happened.
Pick any metric, from net profit to gross sales from returning customers, and Cifra breaks it into the metrics underneath it. Every branch shows how much it changed, its share of the change and a plain-language explanation of what happened.

Key Benefits
Key Benefits
Find the cause, not just the change.
Find the cause, not just the change.
Every number in the tree is compared with the period you choose. Cifra ranks the branches by how much they moved the number above them, so you read the biggest driver first.
Every number in the tree is compared with the period you choose. Cifra ranks the branches by how much they moved the number above them, so you read the biggest driver first.
Every number in the tree is compared with the period you choose. Cifra ranks the branches by how much they moved the number above them, so you read the biggest driver first.
Start from any metric
Start from any metric
Search for the number you care about, like Net Profit, Net Profit Margin or Gross Profit, and the tree builds itself below it, down to the inputs of every formula.
Search for the number you care about, like Net Profit, Net Profit Margin or Gross Profit, and the tree builds itself below it, down to the inputs of every formula.
Search for the number you care about, like Net Profit, Net Profit Margin or Gross Profit, and the tree builds itself below it, down to the inputs of every formula.

The biggest driver, flagged
The biggest driver, flagged
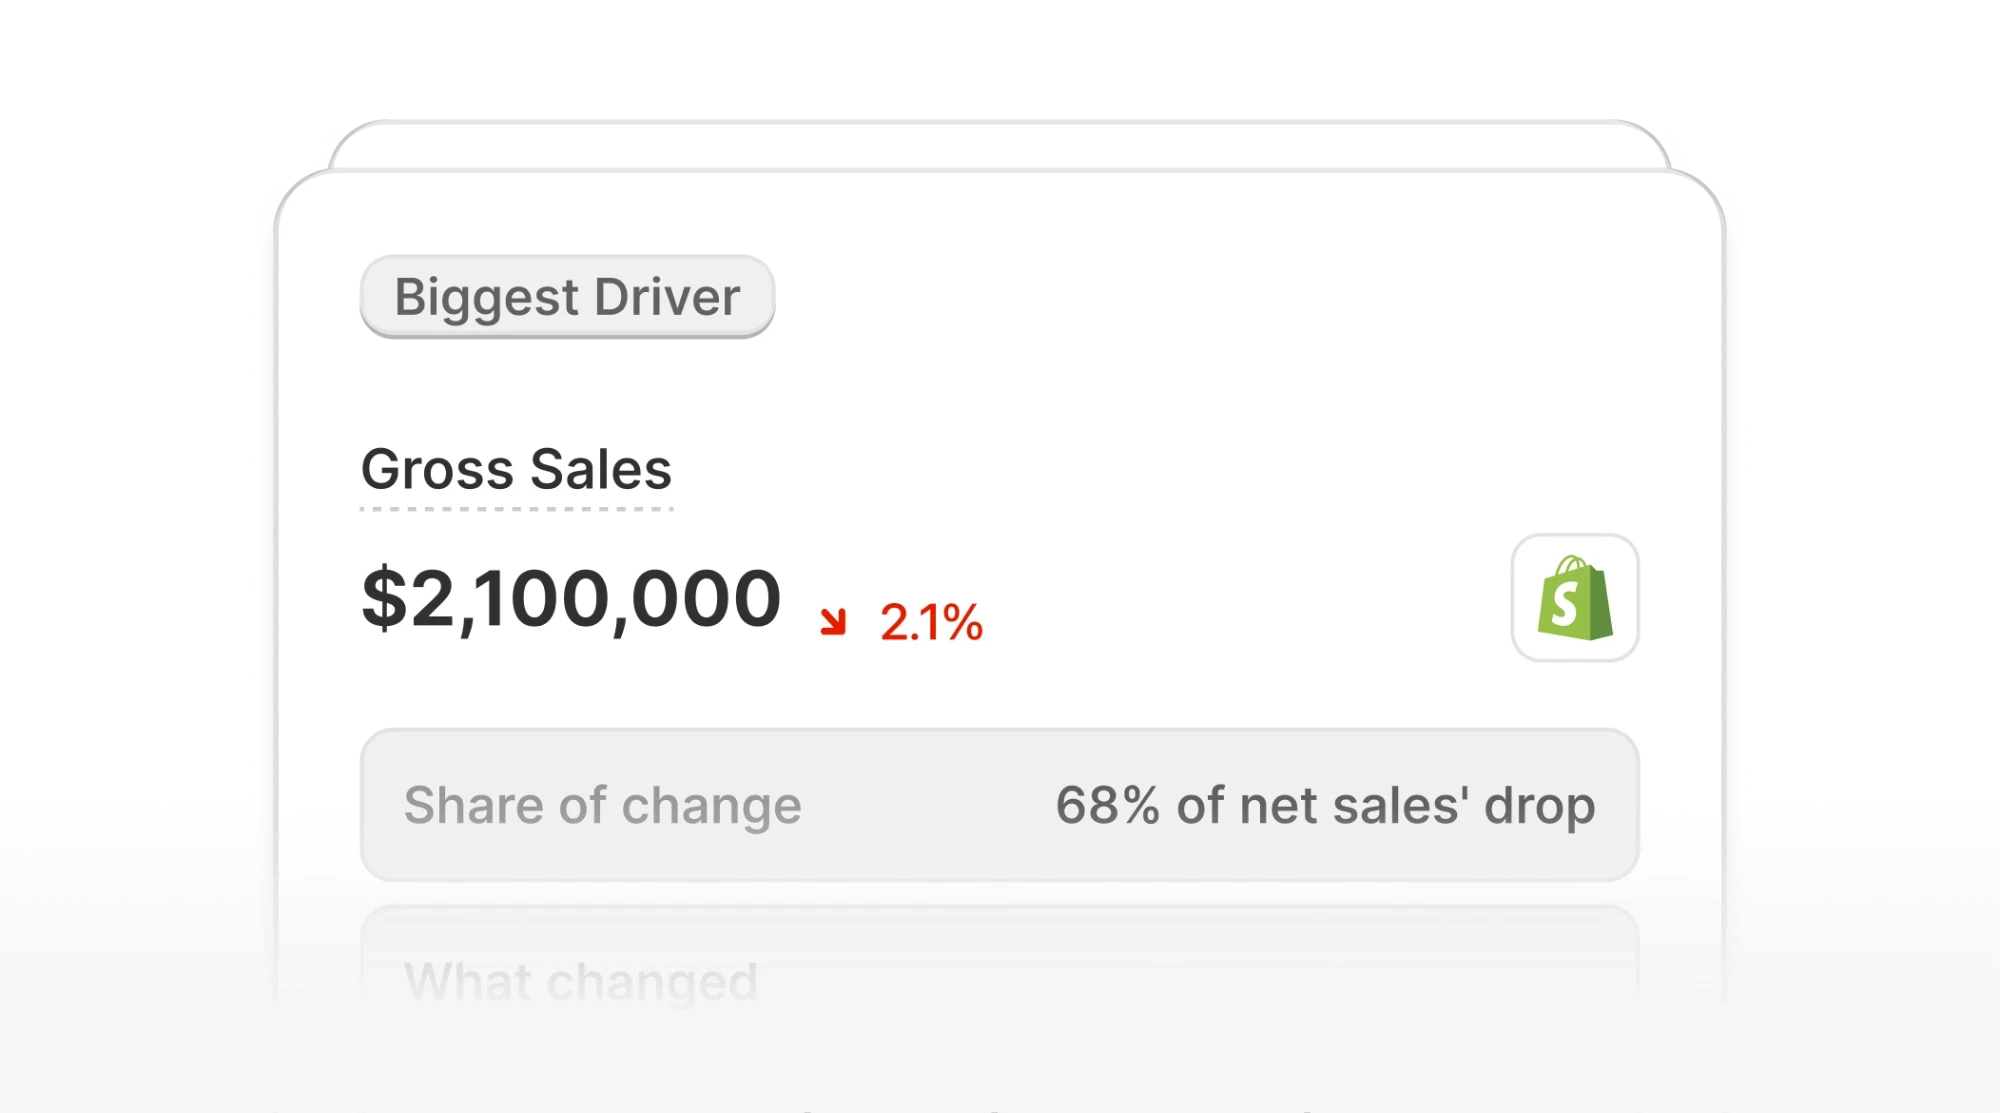
Each branch shows its share of the change, for example 91% of net profit’s increase, and the branch that moved it most is marked as the Biggest Driver.
What changed, in plain language
What changed, in plain language
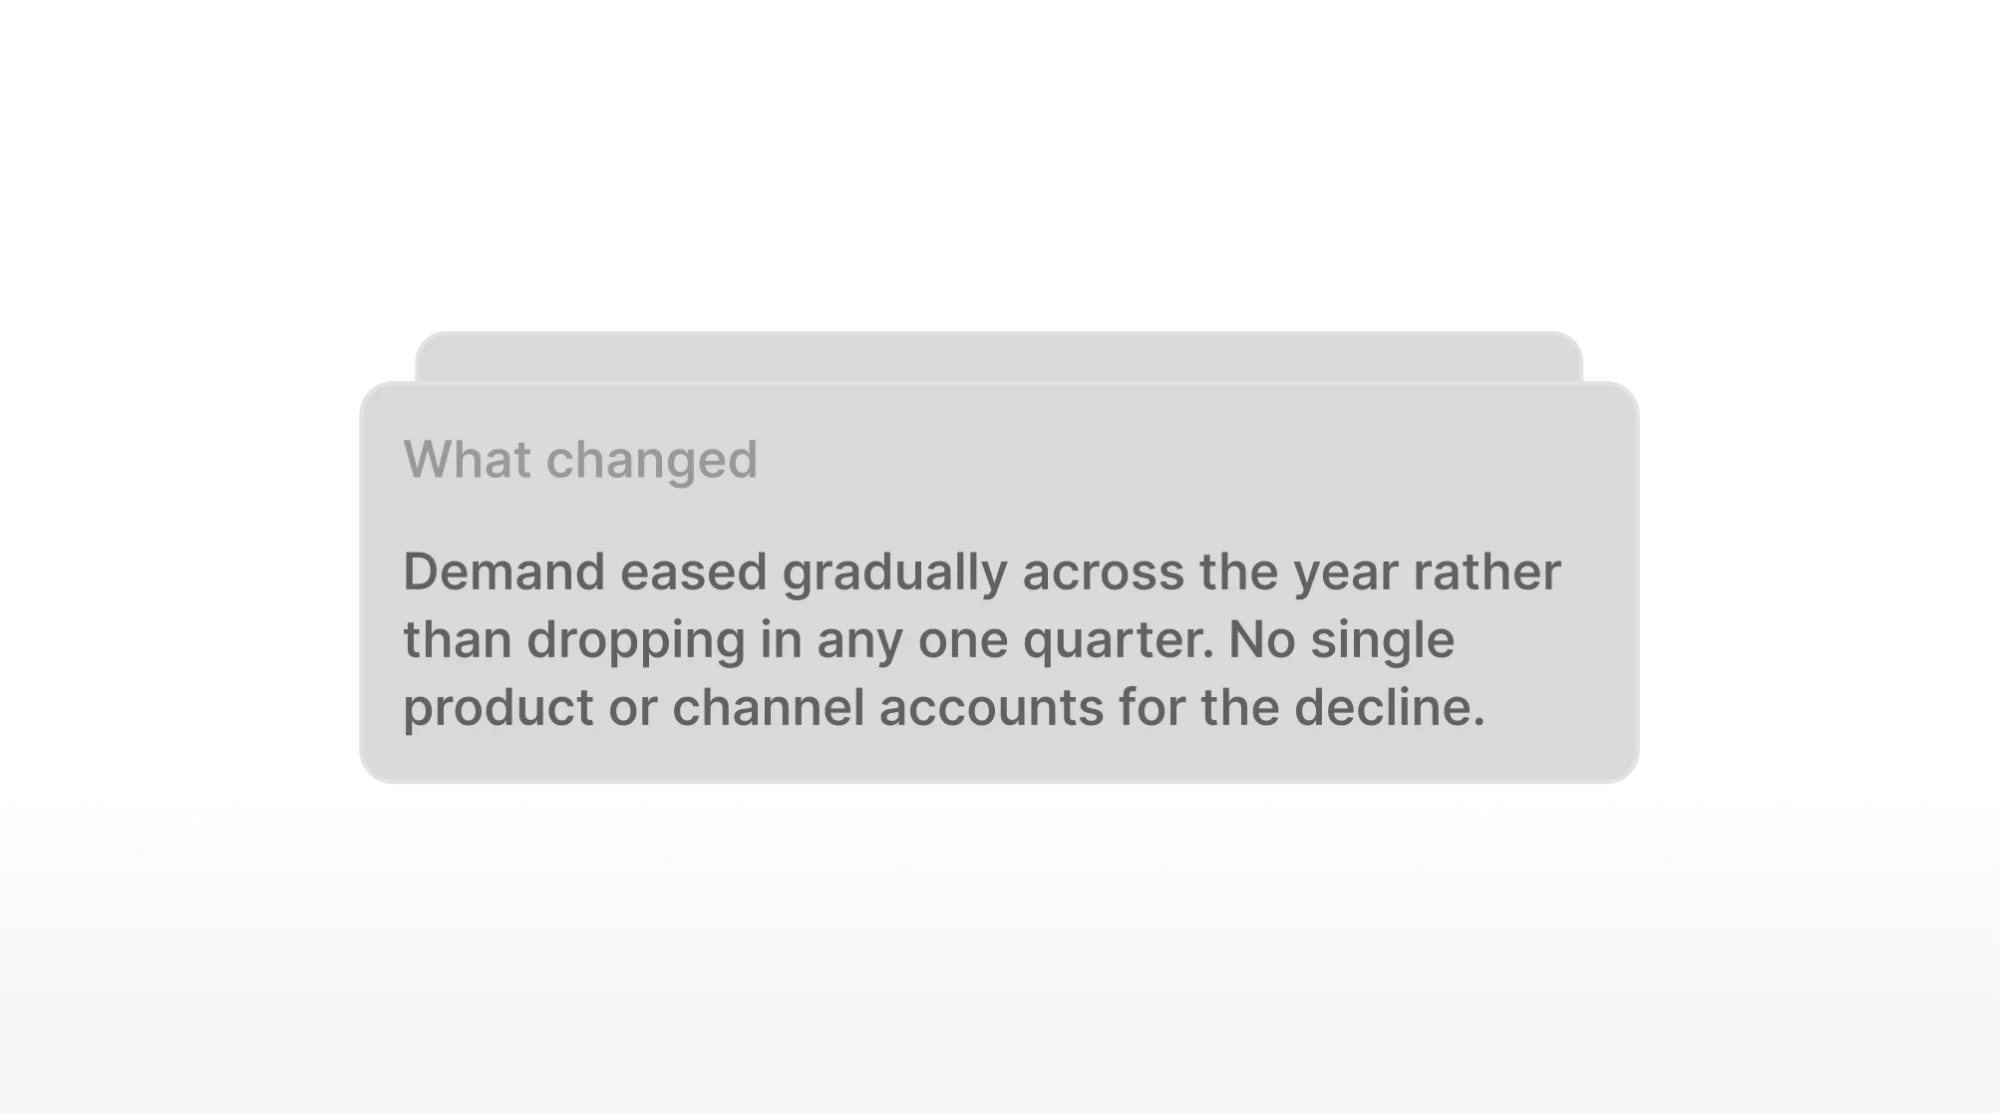
Every number comes with a short explanation written by Cifra, next to the current and previous values, so you know why it moved without building a report.
Every number comes with a short explanation written by Cifra, next to the current and previous values, so you know why it moved without building a report.
Every number comes with a short explanation written by Cifra, next to the current and previous values, so you know why it moved without building a report.
Open only the branches you need
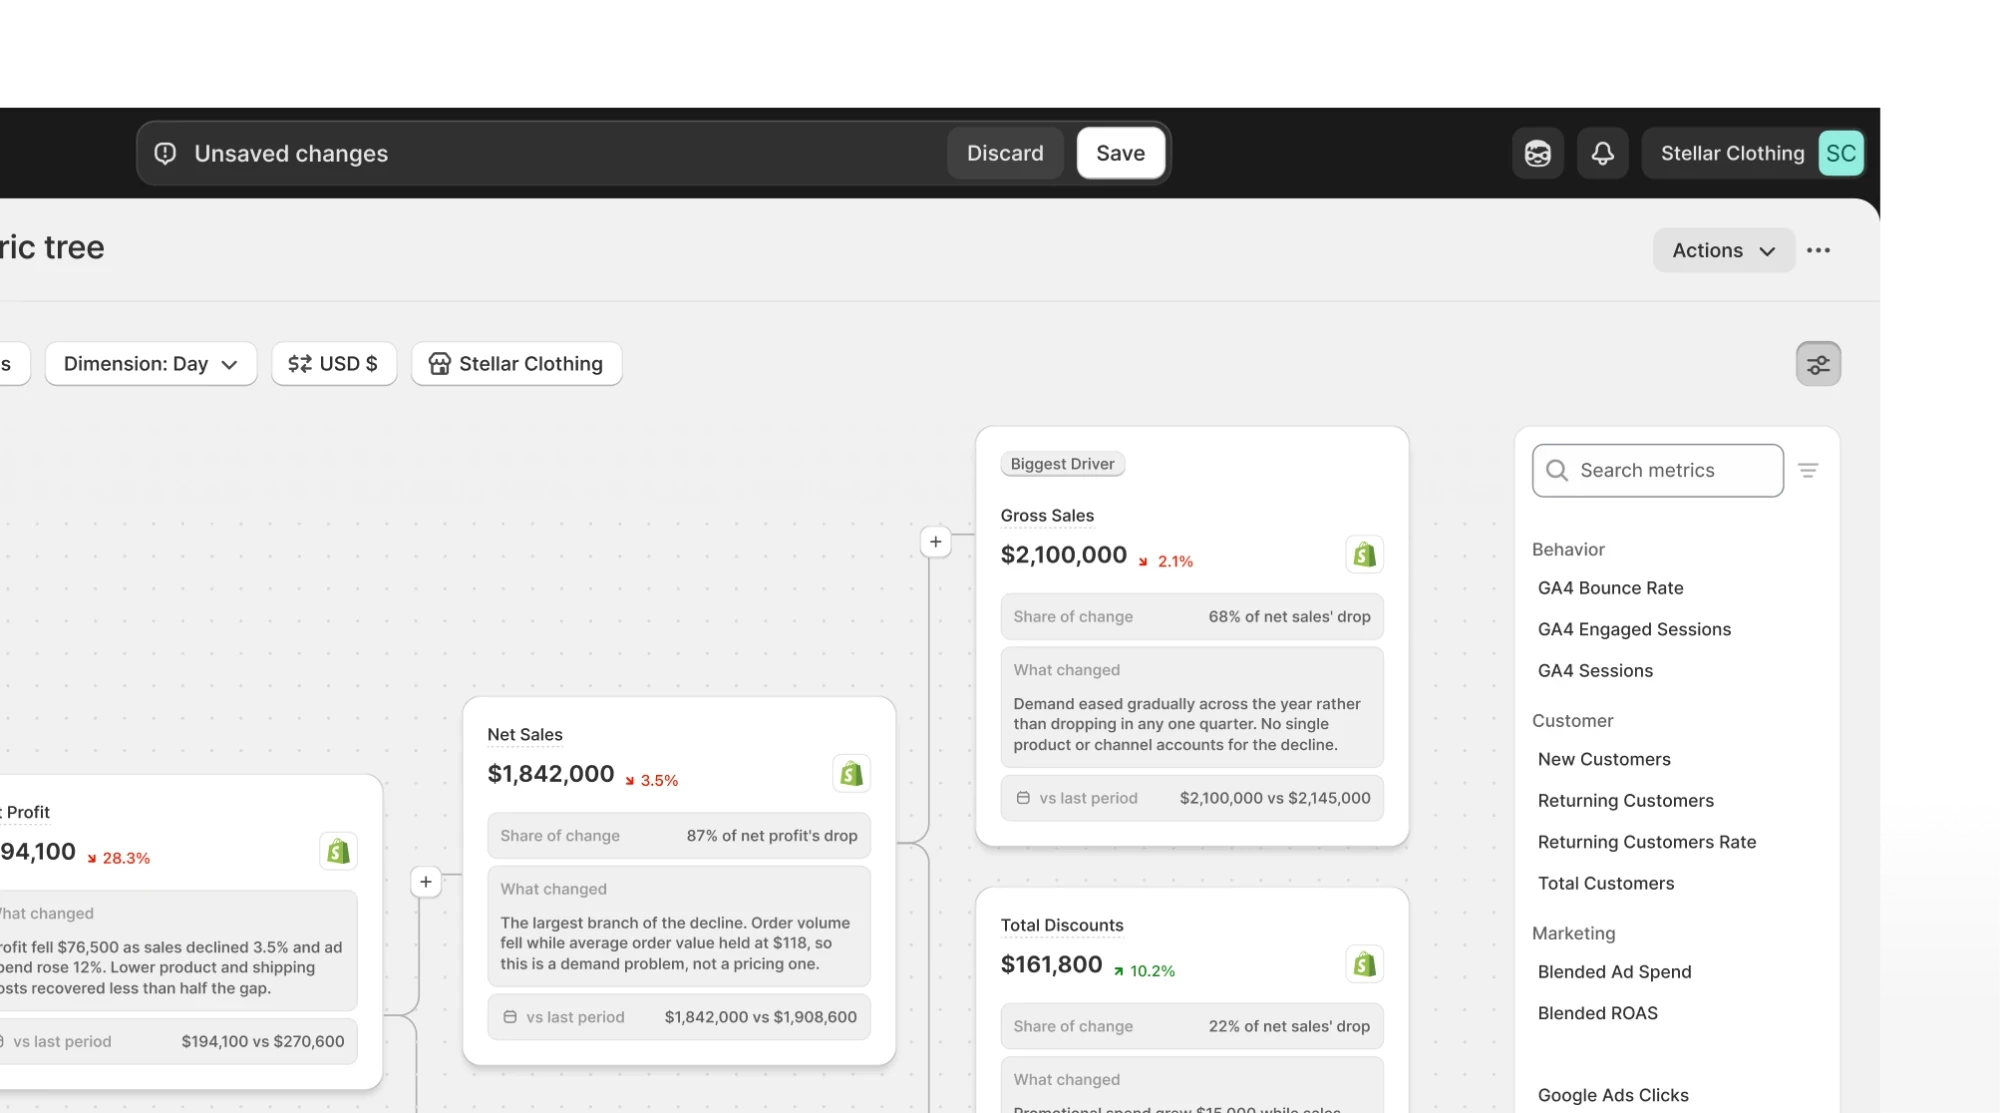
Expand or collapse any branch, zoom in and out, and follow one path from net profit down to discounts, returns or cost of goods.
Your period, your currency
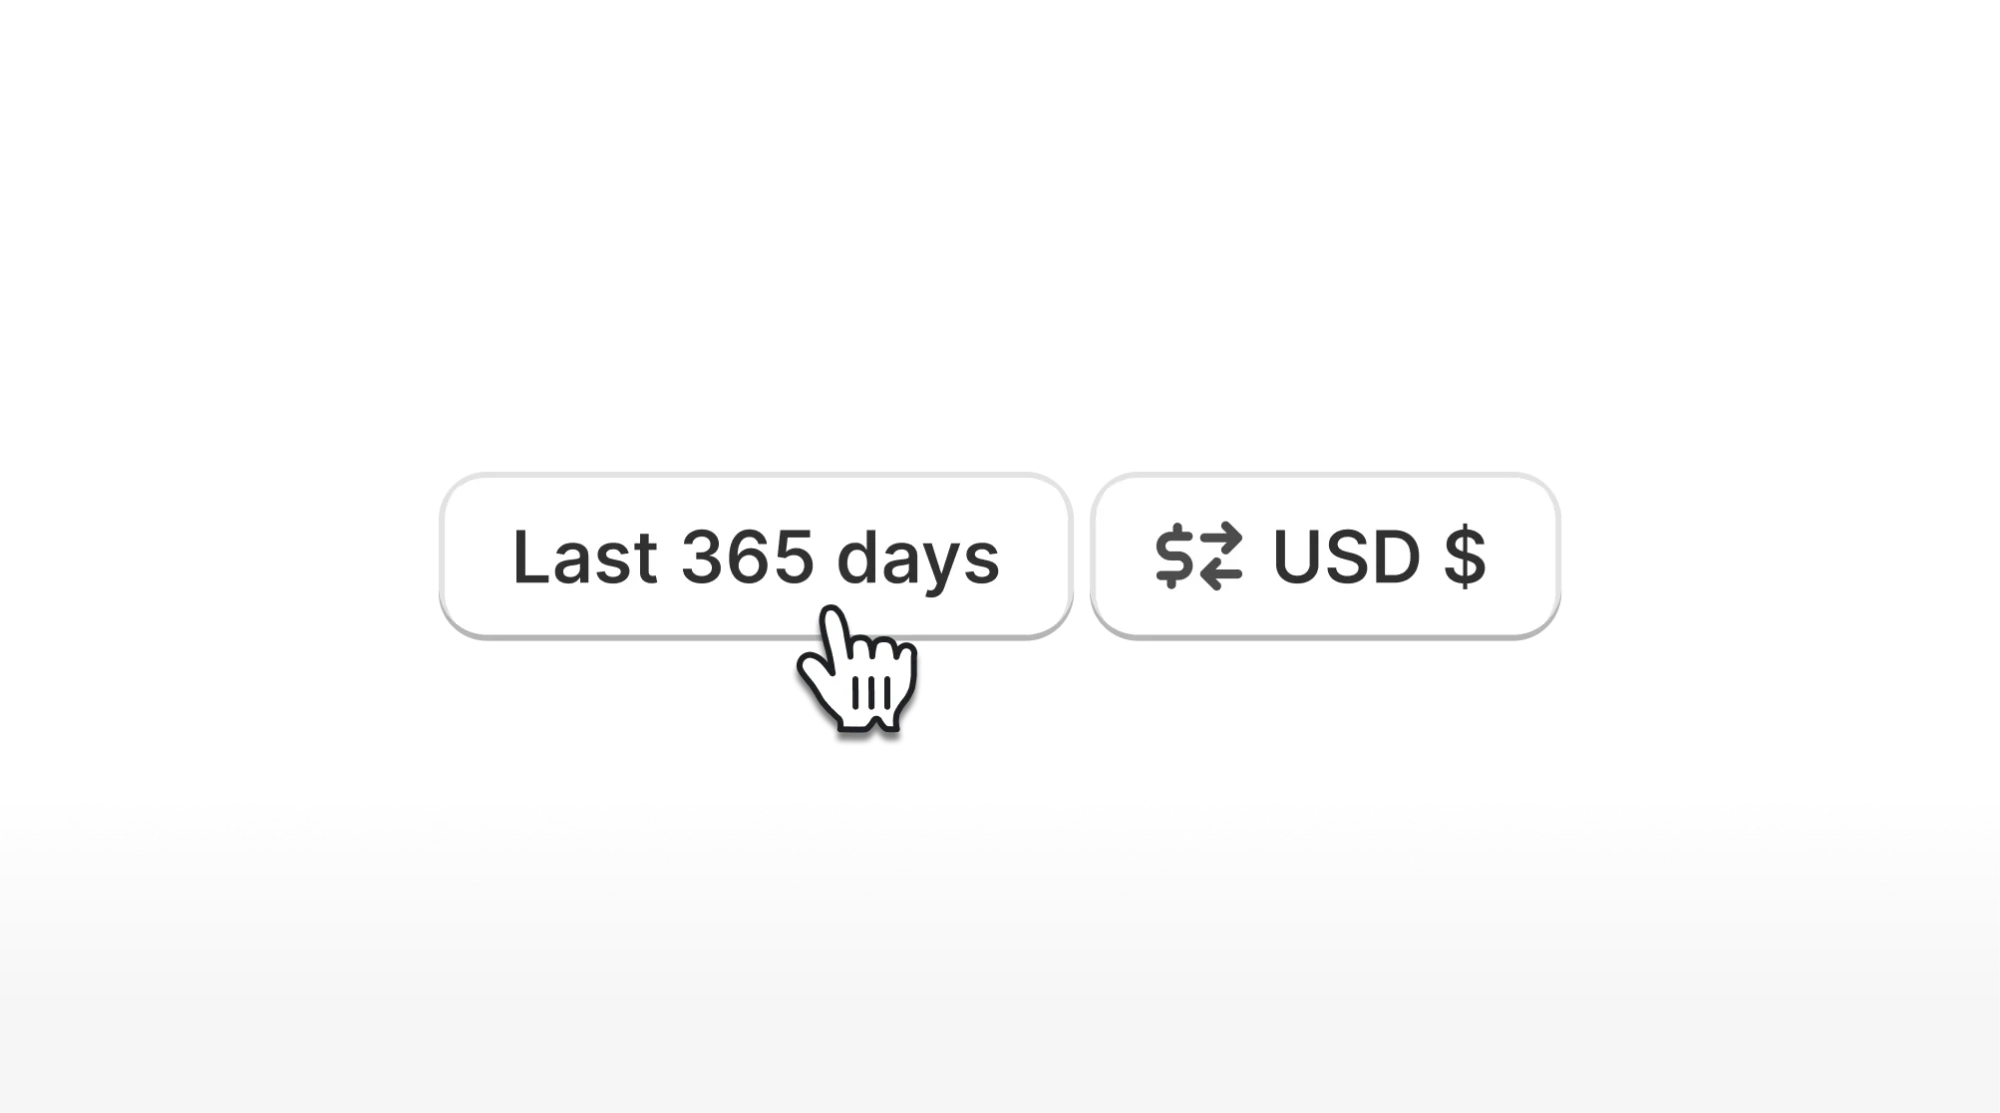
Compare any date range with the previous period or quarter, and read every number in your store’s currency.
See Cifra Live
See Cifra Live
See Cifra Live
Learn in one minute how Cifra centralizes your data and helps you grow. No waiting. No commitment.
Learn in one minute how Cifra centralizes your data and helps you grow. No waiting. No commitment.
Learn in one minute how Cifra centralizes your data and helps you grow. No waiting. No commitment.
Watch instant demo
Cifra is Here!
Cifra is Here!
Cifra is Here!
Download the app today and start optimizing your e-commerce.
Download the app today and start optimizing your e-commerce.
Download the app today and start optimizing your e-commerce.
Get Started