Blog
Jesús Avendaño
·
Most Shopify store owners track Total Sales. That number feels good — until you realize it says nothing about whether the business is actually profitable. Total Sales hides margin erosion, sessions hide conversion quality, and orders hide whether you're acquiring customers profitably or just burning budget to break even.
In 2026, the stores that scale are watching a tighter set of metrics: ones that connect revenue to cost, and acquisition to retention. Below are the seven KPIs that matter most, what each one tells you, and how to use them to make sharper decisions.
KPI | What it measures | Why it matters | Healthy benchmark |
|---|---|---|---|
Net Revenue | Total Sales minus refunds, returns, and discounts | Shows what actually landed in the business | Track week-over-week trend |
Contribution Margin | Net Revenue minus COGS and variable costs | True per-order profitability | 30–45% gross margin range |
Blended ROAS | Total revenue ÷ total ad spend (all channels) | Honest marketing efficiency | Above ~2.2–2.8x to be profitable |
Customer Acquisition Cost (CAC) | Marketing spend ÷ new customers | Early signal of channel saturation | Profitable on first order is ideal |
Average Order Value (AOV) | Net Revenue ÷ number of orders | Direct lever on marketing efficiency | Shopify avg ~$72–98 by channel |
Returning Customers Rate | % of orders from repeat buyers | Signals product-market fit & loyalty | Above 20% for stores 12+ months |
Refund Rate | % of revenue/orders refunded | Quiet margin killer | Below the 17–20% ecommerce avg |
Why this matters: most Shopify stores operate on gross margins of 30–45%, but net profit margins typically land around 10% after all costs (Shopify / Chargeflow, 2026). With the average ecommerce return rate sitting at 17–20% of items sold (Red Stag Fulfillment, 2025) and Meta CPAs around $38 (Triple Whale, 2025), the gap between revenue and profit is where most stores quietly lose money. These seven KPIs are designed to close that gap.
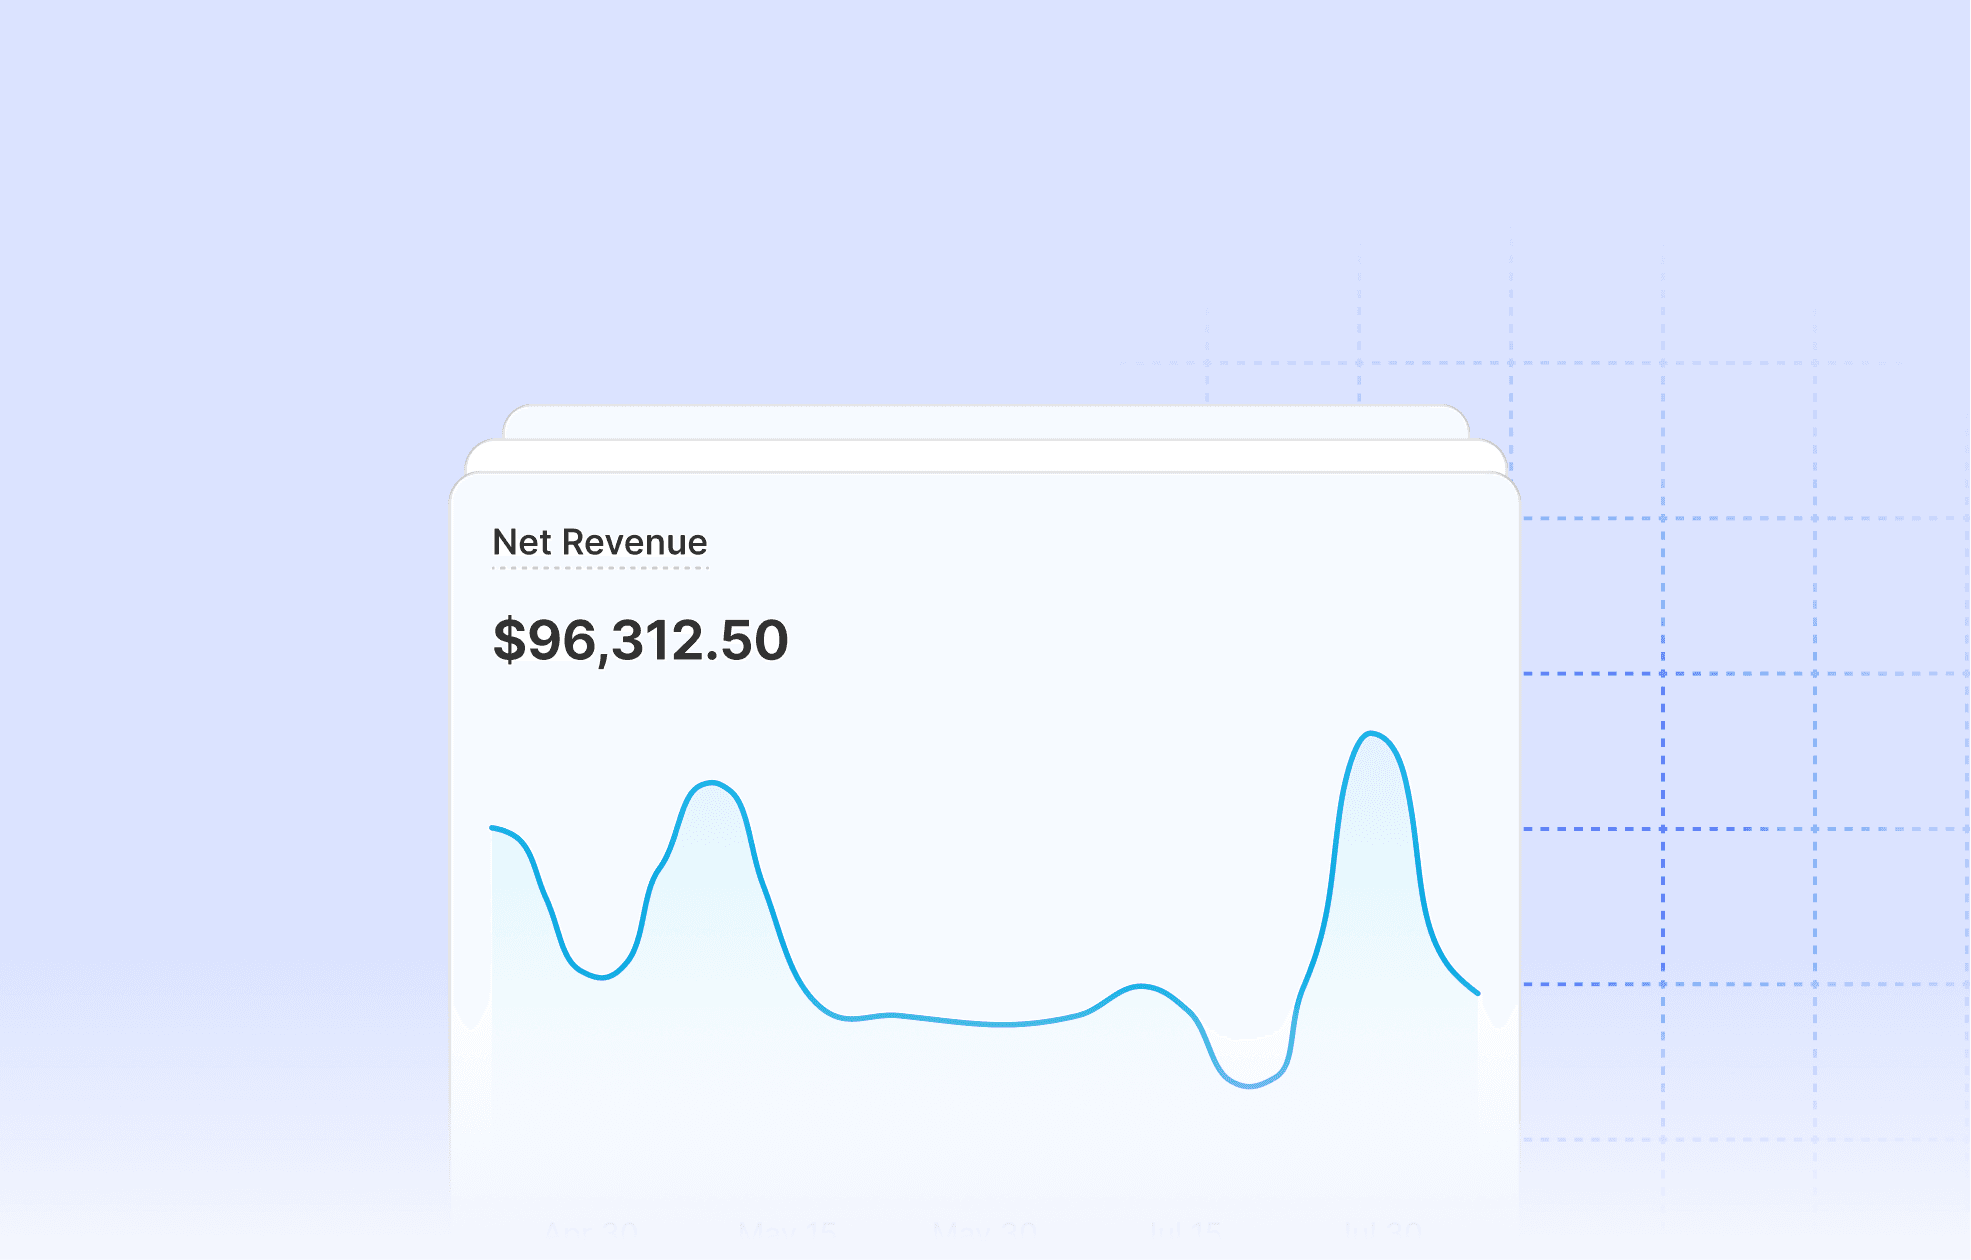
1. Net Revenue
Net Revenue is Total Sales minus refunds, returns, and discounts. If your refund rate is high or you're running aggressive discount campaigns, Total Sales is a vanity metric — Net Revenue shows what actually landed in your business after those deductions.
Track it week over week, not just month over month. A sudden mid-month dip often signals a product quality issue or a discount campaign cutting deeper than intended. If April 2026 shows $180,000 in Total Sales but $22,000 in refunds and $14,000 in discount redemptions, your Net Revenue is $144,000. That's the number you plan around.
2. Contribution Margin
Contribution Margin is Net Revenue minus Cost of Goods Sold (COGS) and variable costs like shipping and transaction fees. It's the closest you get to true profitability at the order level without accounting for fixed overhead — and a product with strong Total Sales but thin Contribution Margin can quietly drain your business.
Segment it by product or category and you'll almost always find that 20–30% of your catalog generates the majority of your margin. That's where ad spend belongs. Consider a $95 product with $38 COGS, $8 shipping, and $3 in transaction fees: its Contribution Margin is $46. A $120 product with $72 COGS and the same variable costs comes in at $37. The cheaper product is the better business.
3. Blended ROAS
Blended ROAS is total revenue divided by total ad spend across all channels. Channel-level ROAS is easy to game — one channel can look efficient while your overall marketing spend isn't. Blended ROAS gives you the honest picture across Meta, Google, TikTok, and any other paid channel you run.
Set a Blended ROAS floor based on your Contribution Margin. At a 45% average margin, you need a Blended ROAS above roughly 2.2x just to break even on ad spend — anything below that and you're subsidizing growth. If you spent $18,000 across all paid channels in May 2026 and generated $54,000, your Blended ROAS is 3.0x. Check it against your Contribution Margin to confirm it's actually profitable, not just impressive.
4. Customer Acquisition Cost
Customer Acquisition Cost (CAC) is total marketing spend divided by the number of new customers acquired in the same period. A rising CAC is one of the earliest signals that a channel is saturating or creative is fatiguing, and catching it early lets you adjust before it damages margins.
Compare CAC month over month and by channel. A 15% increase on Meta while Google holds steady tells you exactly where to reallocate budget. If you spent $12,000 in April 2026 and acquired 400 new customers, your CAC is $30 — and with an $85 AOV at 48% Contribution Margin, your first-order margin is $40.80. You're profitable on the first purchase. That's the target.
5. Average Order Value
Average Order Value (AOV) is Net Revenue divided by total number of orders, and it's one of the most direct levers you control. A 10% increase in AOV without increasing ad spend is effectively a 10% improvement in marketing efficiency.
Segment AOV by traffic source, customer type, and product category. Returning customers almost always show a higher AOV than new ones — a strong argument for retention investment. If AOV from paid social is $72 but AOV from email is $98, that gap tells you email customers are buying more per order, likely because they already trust the brand. Your email strategy deserves more attention.
6. Returning Customers Rate
Returning Customers Rate is the percentage of orders placed by customers who have purchased at least once before. A high rate signals product-market fit and brand loyalty; a low one means you're on a treadmill, constantly spending to replace customers you aren't retaining.
Track it monthly. A Returning Customers Rate below 20% for a store older than 12 months is a warning sign that your retention mechanics — email flows, loyalty programs, post-purchase experience — need work. If 31% of your Q1 2026 orders came from returning customers and that dropped to 22% in Q2, that shift alone warrants a full audit of your post-purchase sequence. Cifra's new vs. returning customer analysis lets you compare AOV, acquisition cost, and profitability between these two groups side by side, so you can see exactly where the retention gap is costing you.
7. Refund Rate
Refund Rate is the percentage of revenue (or orders) returned to customers as refunds over a given period. It's the quietest margin killer on this list: every refund reverses a sale you already paid to acquire, shipped, and processed — so the cost lands twice while the revenue lands at zero. A product can post strong Total Sales and a healthy Contribution Margin on paper, and still bleed profit if a meaningful share of those orders come back.
Track it by product and by reason, not just as a store-wide average. A store-wide Refund Rate of 4% might look fine until you segment it and find one product returning at 18% — usually a signal of sizing issues, misleading descriptions, quality problems, or expectations the listing oversold. If you booked $180,000 in Total Sales in April 2026 and issued $22,000 in refunds, your Refund Rate is roughly 12%, and that's $22,000 of fully-loaded cost — ad spend, COGS, and shipping included — that produced no revenue. Watch it alongside your Contribution Margin: a 1-point drop in Refund Rate often moves the needle on profit more than a 1-point lift in conversion. Cifra surfaces refunds directly against Net Revenue and margin, so you can see which products are quietly eroding the numbers the other six KPIs make look healthy.
How these KPIs work together
No single KPI tells the full story. The real power comes from the relationships between them. A rising CAC paired with a falling Returning Customers Rate means acquisition is getting more expensive while retention weakens — a compounding problem. A high Blended ROAS paired with a low Contribution Margin means revenue looks healthy but margins don't. And a climbing Refund Rate quietly drags down Net Revenue and Contribution Margin at the same time, so a store can look like it's growing on Total Sales while its real profitability slips.
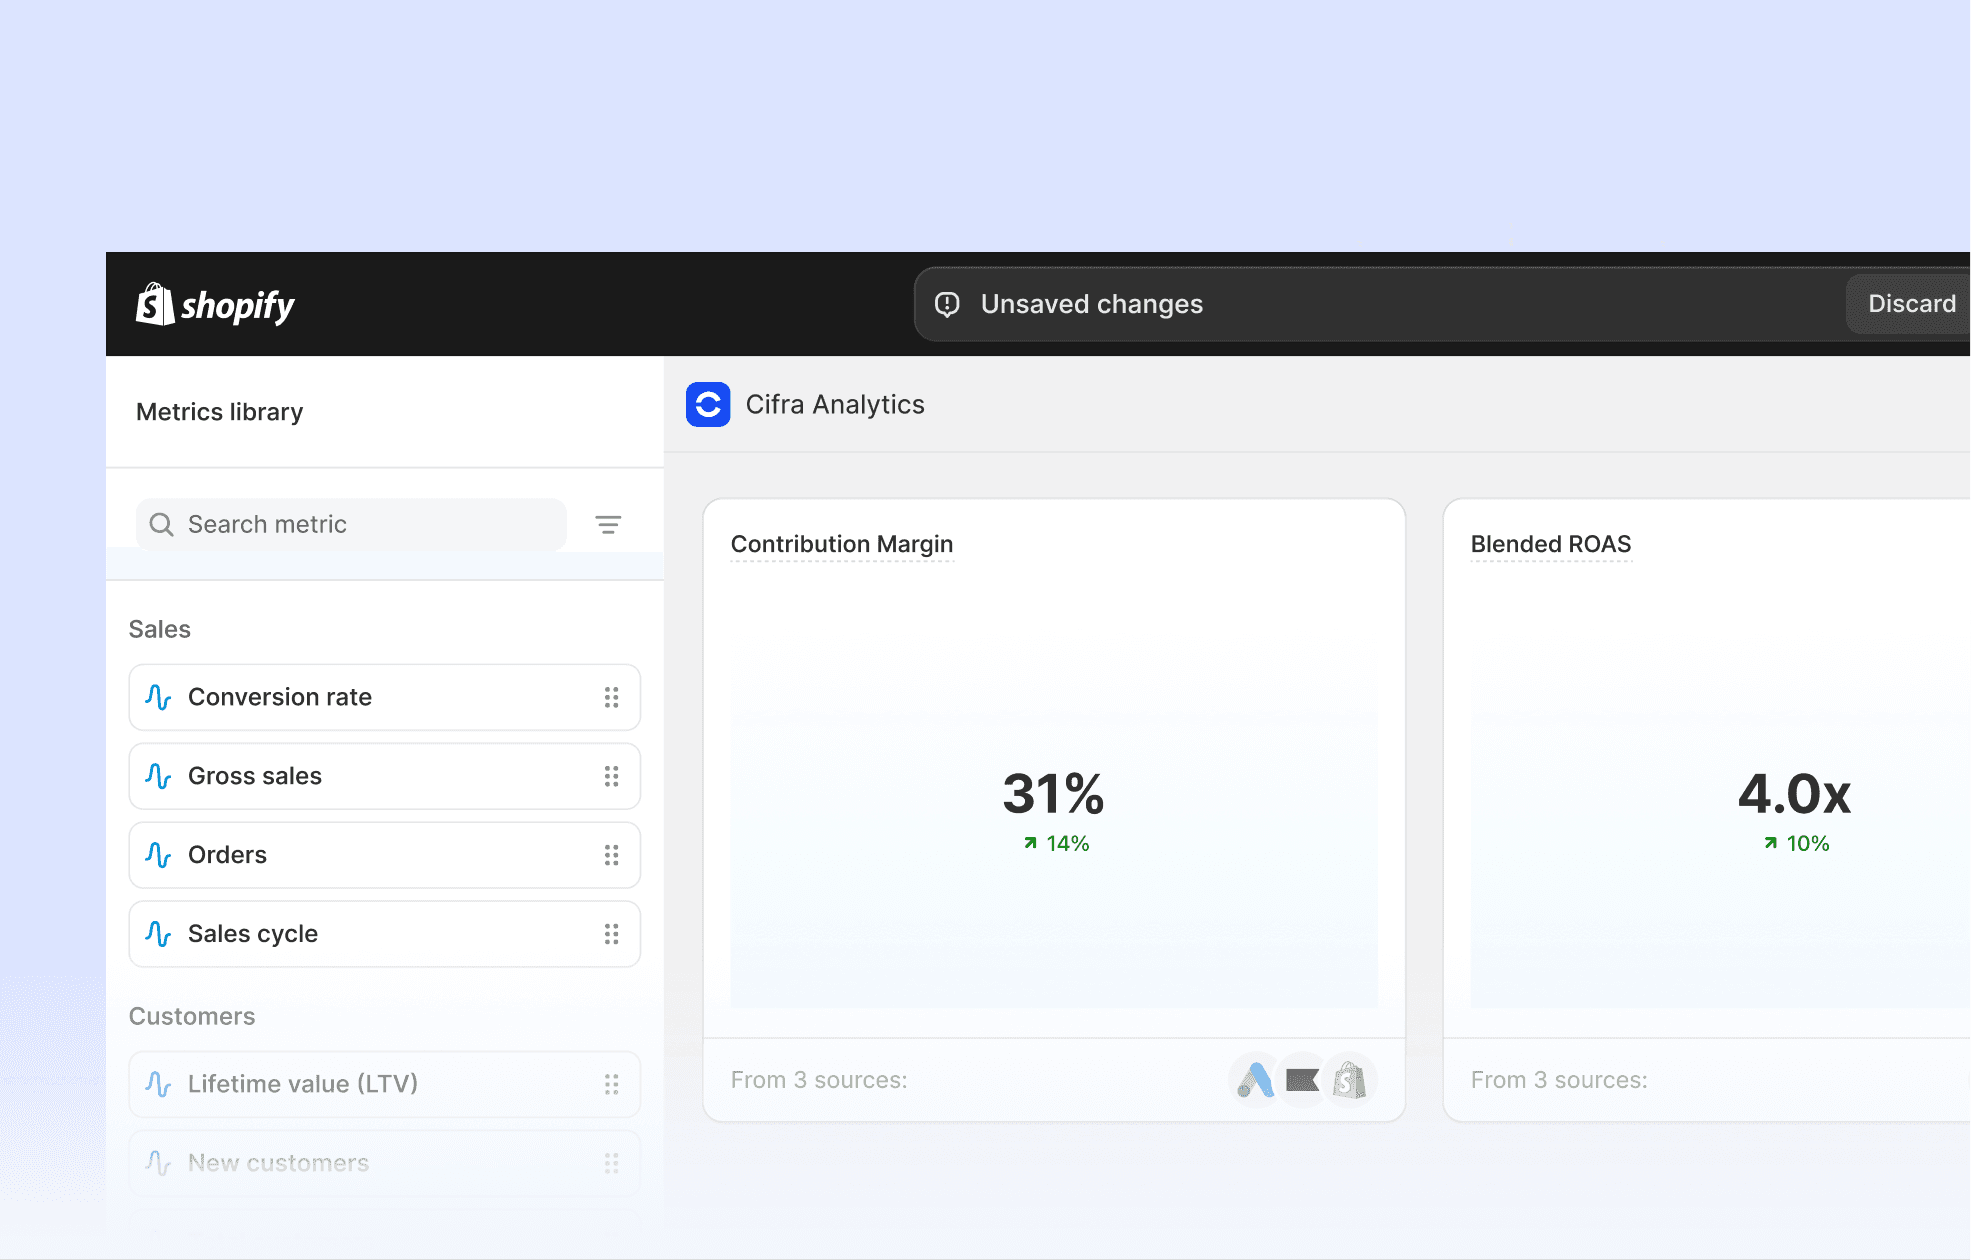
These signals only surface when your data is centralized. If your sales data lives in Shopify, your ad spend in Meta Ads Manager, and your COGS in a spreadsheet, you're always working with a partial picture. Cifra unifies all of it into a single real-time Dashboard — Total Sales, Net Revenue, Contribution Margin, Blended ROAS, CAC, AOV, Returning Customers Rate, and Refund Rate in one place. If you run more than one store, the multi-store centralization view lets you track every KPI across connected stores without switching accounts. And for teams that want to query their data directly, Cifra's MCP integration lets you pull specific comparisons in natural language — like "Show me Contribution Margin by product category for Q1 2026 vs Q1 2025" — without building a custom report from scratch.
"Total Sales is the most reassuring number on a Shopify dashboard and the least useful. Profit lives in the relationships between metrics, not in any single one."
— Cifra Product Team
Warning signs to watch for
Rising CAC + falling Returning Customers Rate → acquisition is getting more expensive while retention weakens. A compounding problem.
High Blended ROAS + low Contribution Margin → revenue looks healthy but you're not keeping much of it.
Climbing Refund Rate → drags down Net Revenue and Contribution Margin at the same time, often hidden behind strong Total Sales.
AOV from email far above AOV from paid social → your retention channels are doing the heavy lifting; fund them more.
Jesús Avendaño
·