Blog
Jesús Avendaño
·
Most Shopify stores aren't losing sales because of bad products or weak traffic. They're losing sales because they can't see clearly enough to act on what's already happening. A 15% lift in Conversion Rate is achievable — not by running more ads, but by making sharper decisions with the data you already have.
The real problem for most operators is fragmentation. Sales data sits in Shopify, ad performance in Meta or Google, customer behavior in a separate analytics tool. Incomplete pictures produce inconsistent results. Below are six data practices that consistently move Conversion Rate when applied with a centralized view.
Where does your Conversion Rate stand?
Performance level | Conversion Rate range | What it usually means |
|---|---|---|
Global ecommerce average | 1.9–2.0% | Most stores live here; lots of room to grow |
Shopify average | 2.5–3.0% | Shopify stores typically outperform the wider average |
Top performers | 3.2–4.7% | The ceiling most stores chase; reachable with better data |
Top-loading pages (1–2 sec) | Up to 3.05% | Speed alone can lift performance into this tier |
Industry varies | 1.58% – 2.73% | Consumer electronics on the low end, food & beverage on the high end |
Sources: Triple Whale Ecommerce Benchmarks 2025, Queue-it Site Speed Report 2026.
1. Find where you're actually losing customers
A low Conversion Rate tells you something is wrong, not where. Break the funnel into segments: which products have high traffic but low conversion? That gap points to a pricing, trust, or presentation problem — not a traffic problem.
Then look at AOV by traffic source. If visitors from one channel convert lower and spend less, that channel is delivering low-intent traffic. Reallocating even 10% of that spend toward higher-converting sources compounds quickly. Instead of asking "why is my Conversion Rate low," ask "why is Conversion Rate for new visitors from paid social lower than organic in April 2026 vs April 2025." That question has an answer.
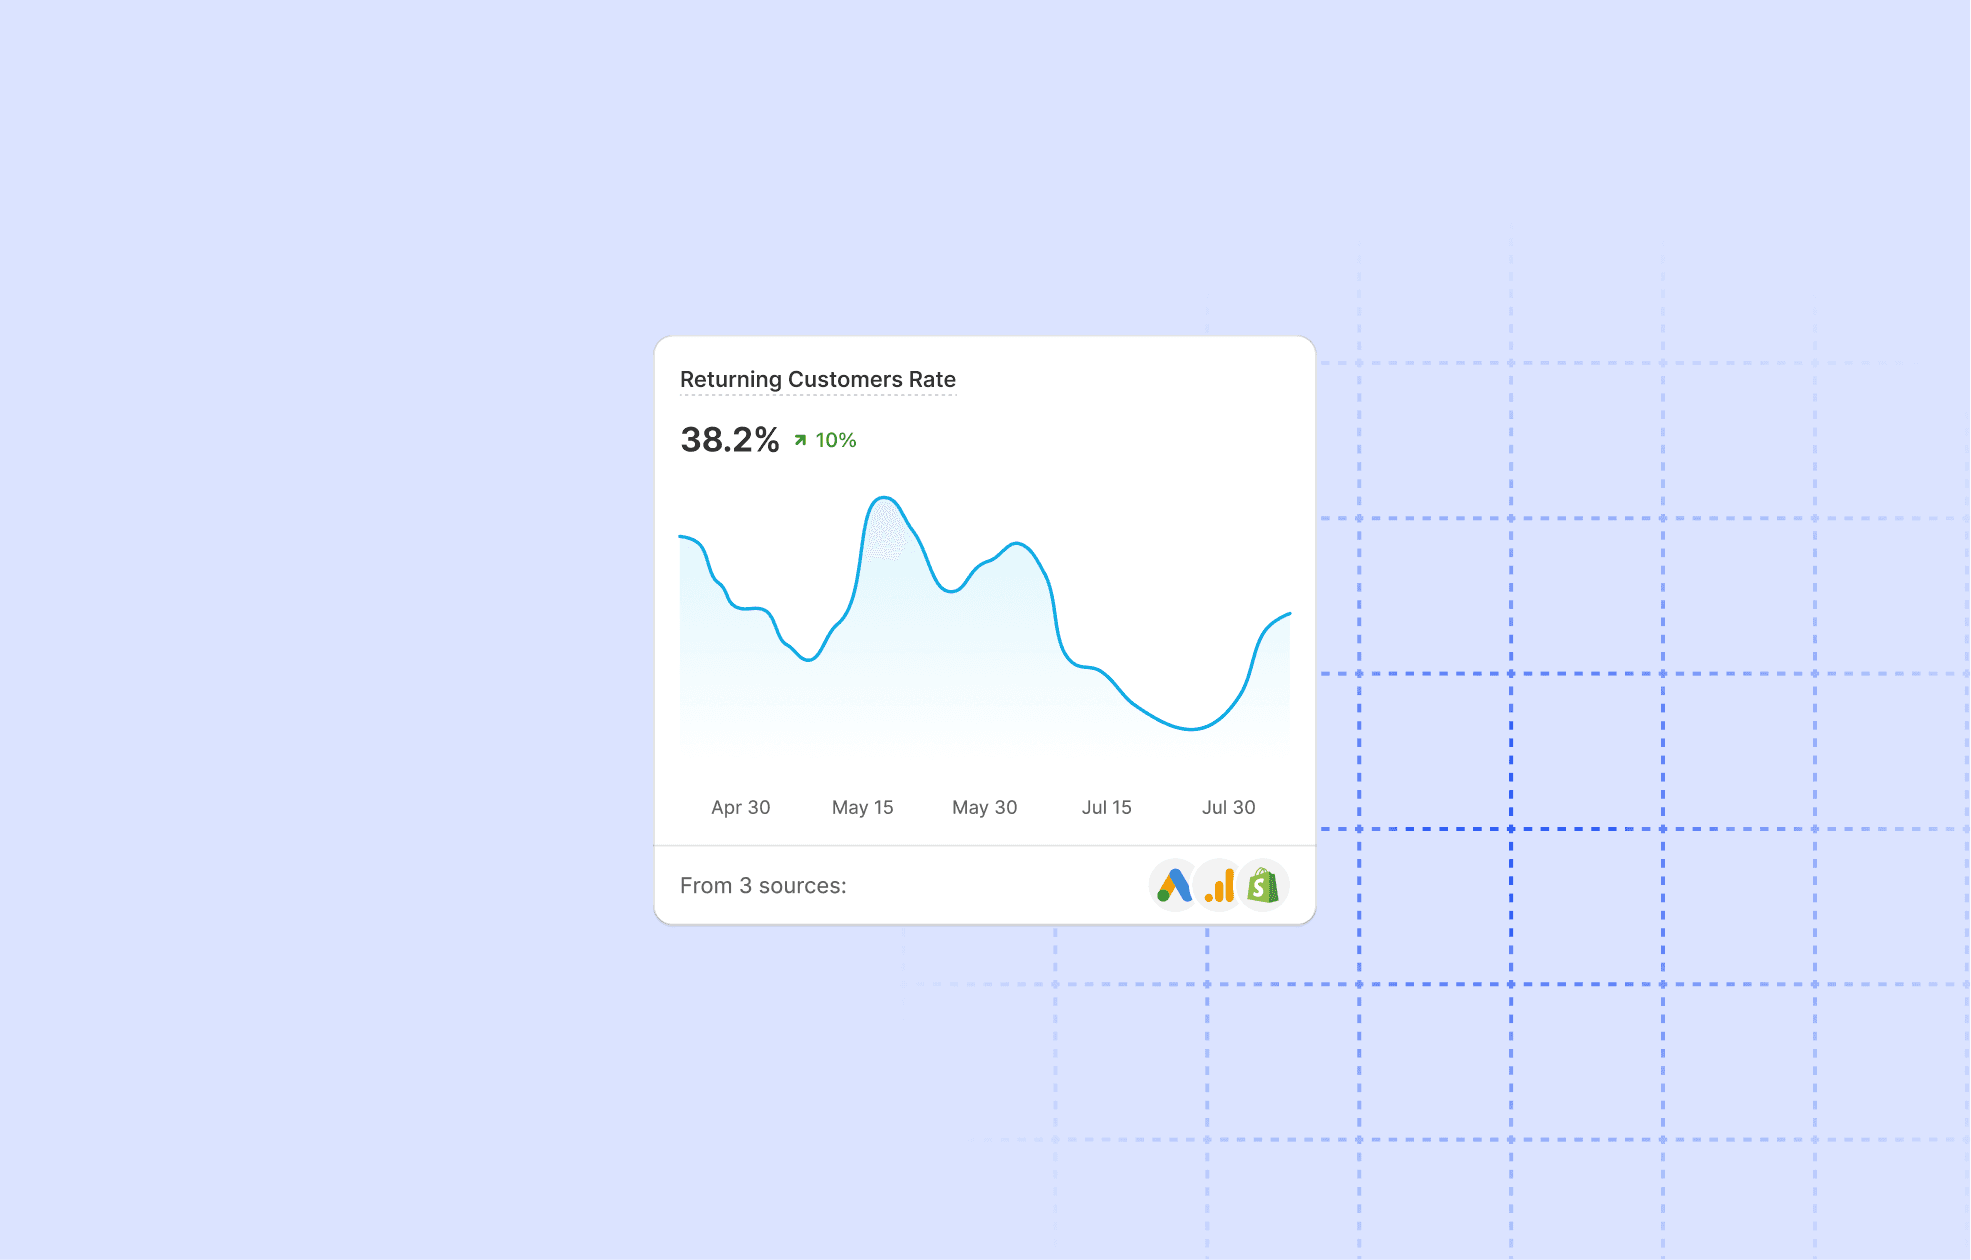
2. Separate new from returning customers
New and returning customers behave differently. They respond to different offers, different messaging, different friction points. Treating them identically is one of the most common reasons Conversion Rate stagnates.
If returning customers convert at twice the rate of new visitors but represent only 30% of your traffic, the directive is clear: invest more in retention and redesign the new visitor experience to reduce friction earlier. A returning customer needs a fast path to repurchase. A new visitor needs social proof, guarantees, and a compelling first offer. One generic page can't do both jobs.
3. Connect marketing spend to conversion, not just clicks
Blended ROAS tells you whether ad spend is generating revenue. It doesn't tell you whether that revenue came from healthy conversion or a small spike of high-value orders masking a broader problem.
Campaign Profitability reporting closes that gap. A campaign with 4x ROAS but 0.8% Conversion Rate is underperforming relative to one with 2.5x ROAS and 3.2% Conversion Rate — depending on your margins. For every active campaign, ask: "What is the Conversion Rate and Contribution Margin for this campaign in May 2026 compared to the previous 30 days?" That single comparison tells you whether to scale, adjust, or cut.
4. Monitor discount impact before it erodes margin
Discounts are one of the fastest ways to lift Conversion Rate short-term, and one of the fastest ways to train customers to wait for sales — which suppresses full-price conversion over time.
Discount Impact reporting shows what a promotion did to Conversion Rate, AOV, and Net Revenue at once. If a 20% discount lifted Conversion Rate by 8% but reduced Net Revenue per order by 18%, the math doesn't work. A 10% discount that lifts Conversion Rate by 12% with minimal AOV erosion is a repeatable lever. Use this data to set thresholds that protect margin.
5. Spot demand patterns before they become missed opportunities
Conversion Rate is partly a function of timing. Customers arriving during a high-intent window — a seasonal moment, a trend spike, a restock — convert at higher rates because their intent is already elevated.
When you can see that Conversion Rate reliably climbs in the third week of each month, or that a specific category spikes in Q1, you can align inventory, ad spend, and on-site experience before demand arrives. For operators running more than one store, seeing patterns across connected stores in a single view — as covered in Cifra's multi-store centralization approach — lets you allocate budget and stock where conversion is most likely.
6. Act on real-time data, not last week's export
The gap between when something happens in your store and when you find out is where conversion opportunities disappear. A product going out of stock, a campaign suddenly underperforming, a pricing error on a high-traffic page — each costs conversions for every hour you remain unaware.
A unified Dashboard that combines Total Sales, Conversion Rate, marketing spend, and Net Revenue in real time means you catch problems in hours, not days. You also catch opportunities — a product trending upward over the last 48 hours is a signal to push more traffic to it immediately. If you want to go deeper, the best prompts for Cifra Analytics MCP shows you how to extract specific conversion insights without building manual reports.
Start converting more of the traffic you already have
The traffic is there. The customers are arriving. The gap between a 1.8% and a 3.2% Conversion Rate is almost always a data visibility problem, not a traffic problem. Stop making decisions from disconnected exports and start acting on a complete, real-time view.
"Most stores don't have a traffic problem or a pricing problem. They have a latency problem — between something happening on the site and the team finding out. Close that gap and conversion follows."
— Cifra Product Team
Five questions to ask your data this week
Which products have the highest traffic but the lowest Conversion Rate?
What's the Conversion Rate of new visitors vs returning customers — and how big is the gap?
Which paid channel is delivering low-intent traffic that drags down blended conversion?
For every active campaign: what's the Conversion Rate and Contribution Margin compared to the last 30 days?
How long does it take you to find out when a high-traffic product is underperforming?
If you can't answer any of these in under five minutes, the gap isn't your traffic — it's your data visibility.
Jesús Avendaño
·