Blog
Jesús Avendaño
·
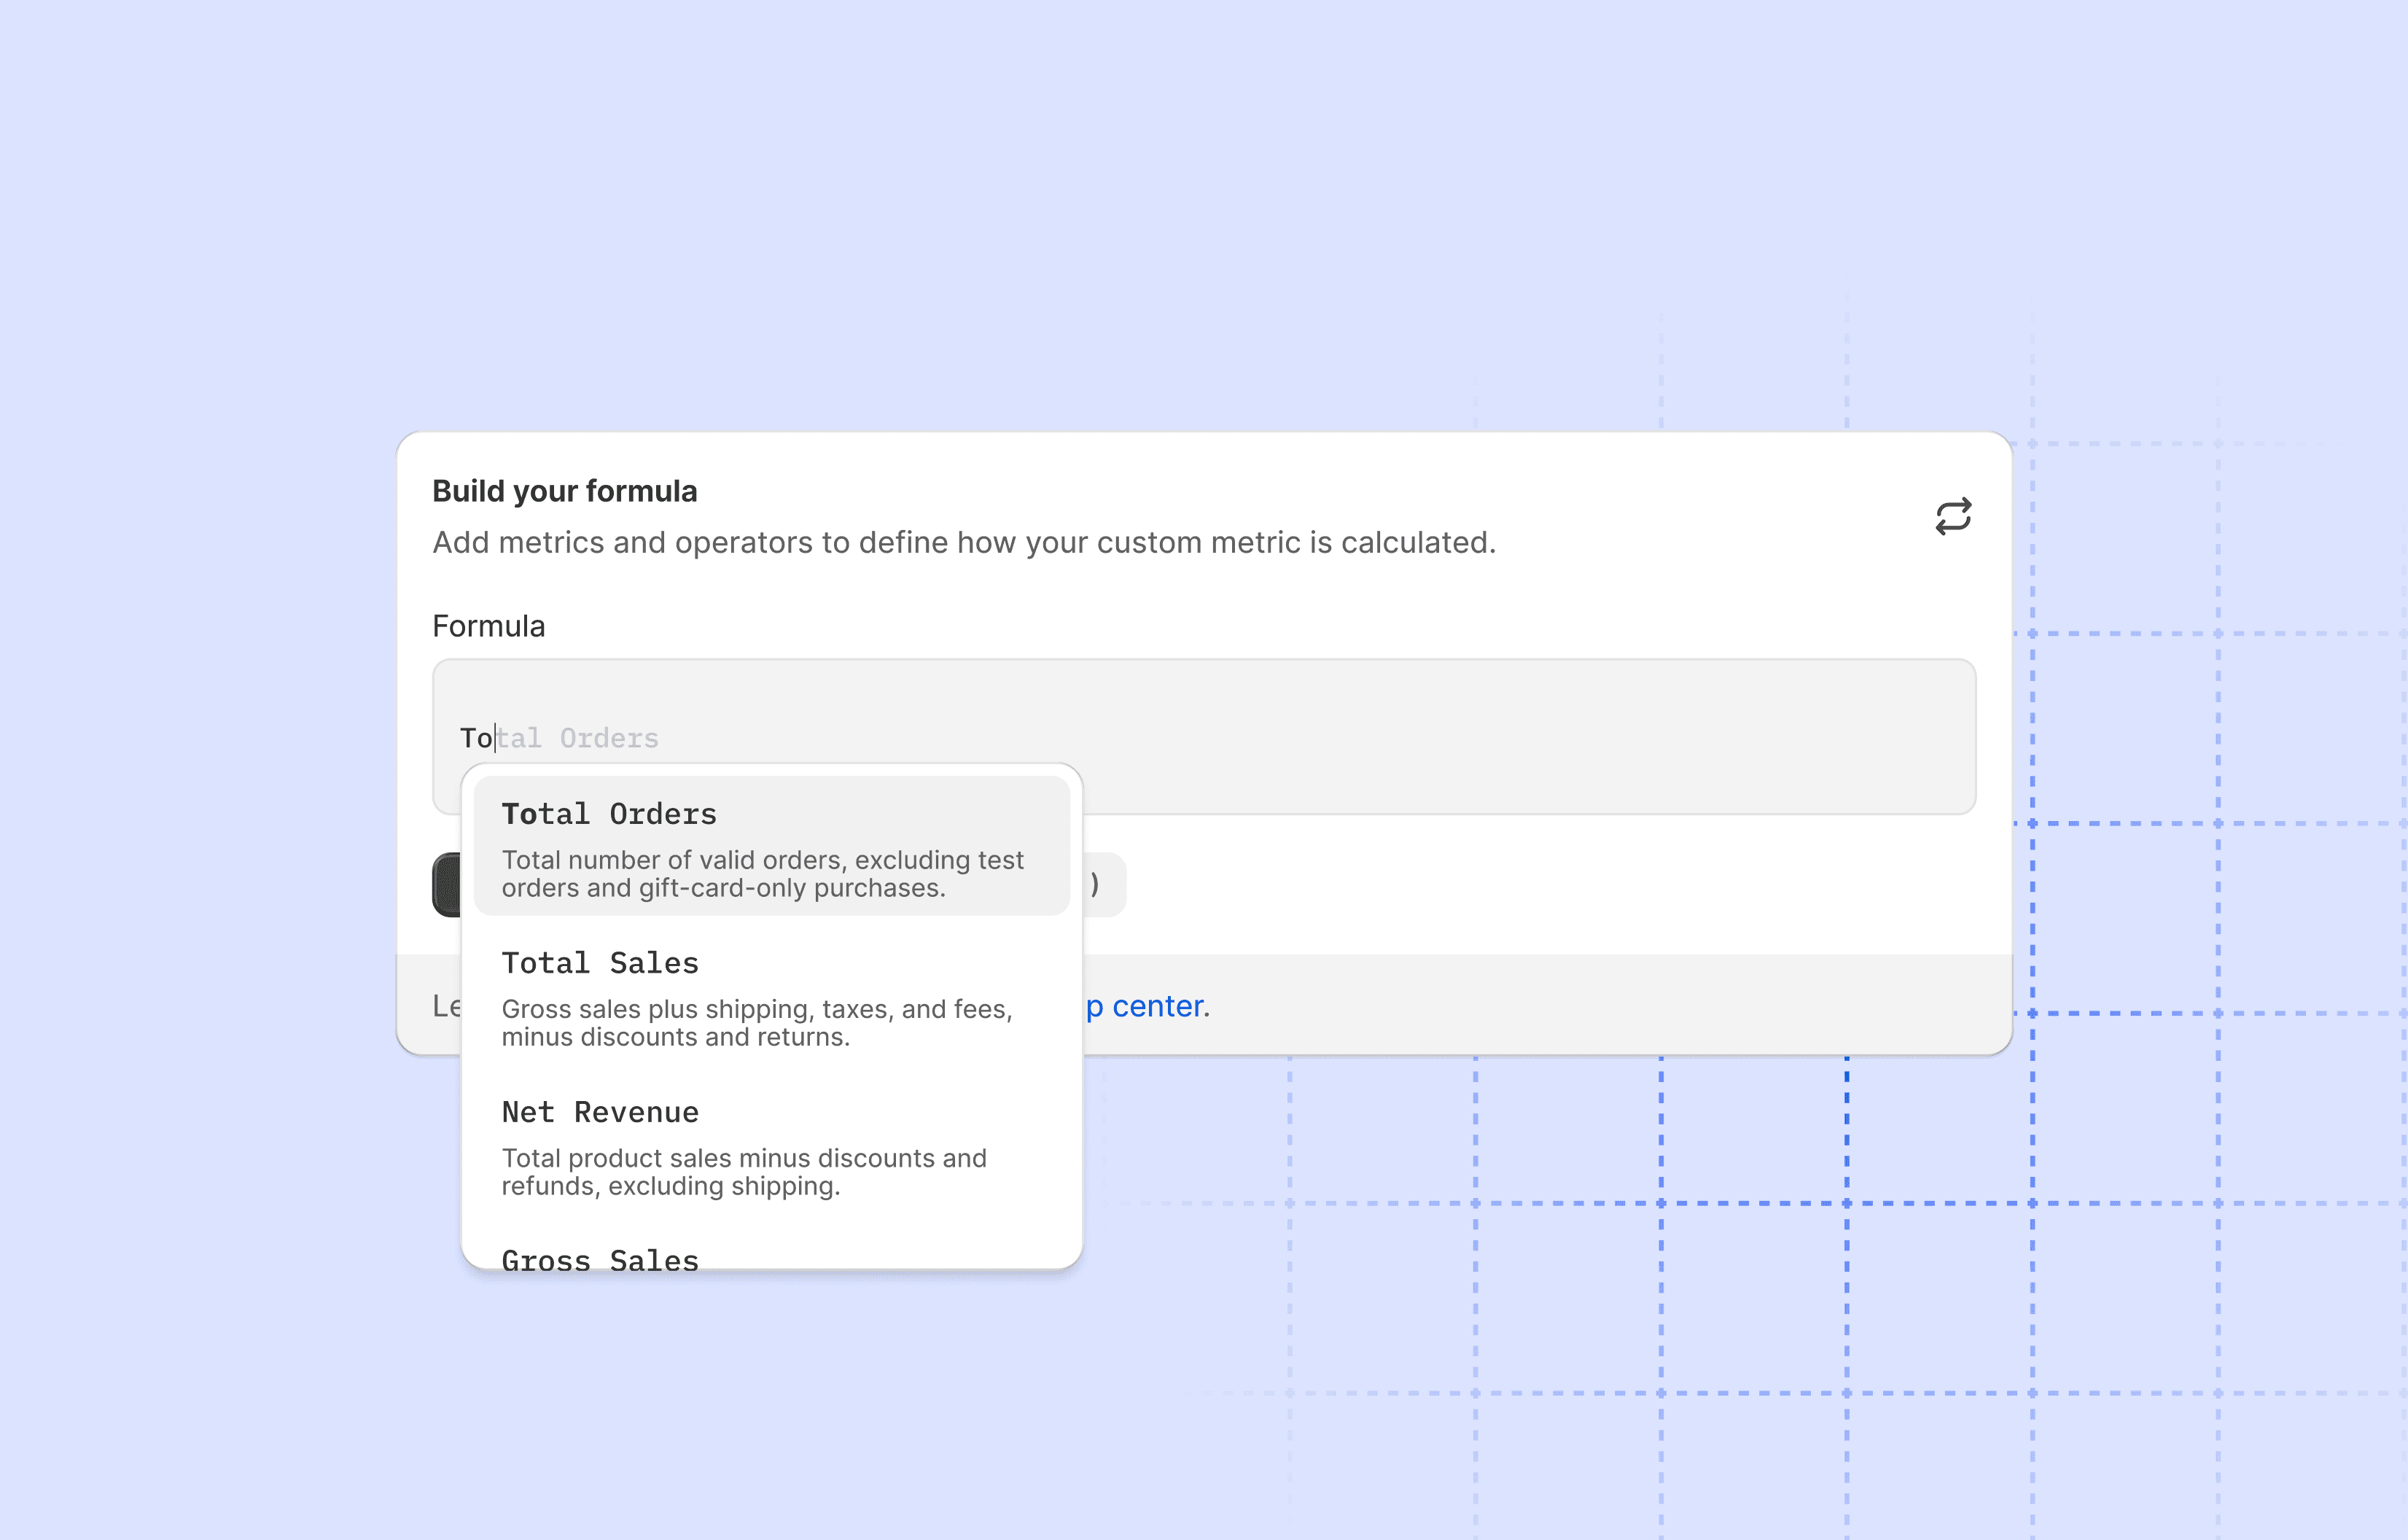
We recently launched the Custom Metric Builder in Cifra, a way to define your own metrics on top of any data source you've connected to your store. Sales, ad spend, GA4 sessions, Klaviyo events, custom expenses: all available as building blocks. You can read the full release notes in our changelog.
Out-of-the-box metrics like Total Sales, ROAS, or AOV cover the basics. But every store eventually hits the same wall: the metric that actually drives your decisions isn't pre-built. It's a ratio between two things, filtered by a specific channel, formatted the way you think about it.
Set the trend indicator carefully
Every custom metric has a trend indicator: green-if-up or red-if-up. For revenue and margin metrics, green-if-up is correct. But for cost metrics like CAC, Refund Rate, or Bounce Rate, flip it to red-if-up. Otherwise a worsening number will show up as "good" on your dashboard.
Use filters on base metrics
Most custom metrics get more useful when you filter the base metric. Total Sales filtered by Channel = Online Store behaves very differently from Total Sales across all channels. Apply the filter directly on the token in your formula instead of building separate metrics per segment.
Six custom metrics to build first
1. Marketing Efficiency Ratio (MER)
Your true blended efficiency across all paid channels. ROAS per platform lies because of attribution overlap. MER doesn't.
Format: Number. Trend: green-if-up.
2. Contribution Margin %
The number your CFO actually cares about. Revenue left after COGS, ad spend, and variable costs, as a percentage of sales.
Format: Percentage. Trend: green-if-up. If this is below 20%, scaling spend will hurt you.
3. New Customer CAC
Acquisition cost that ignores returning customers. The only CAC that's actually comparable across periods.
Format: Currency. Trend: red-if-up.
4. Profit on Ad Spend (POAS)
ROAS with margin baked in. Two stores with identical ROAS can have wildly different POAS depending on product margin.
Format: Number. Trend: green-if-up. Anything under 1 means you're paying customers to buy from you.
5. Revenue from New Customers %
The single best signal of acquisition health. If this drops while total revenue stays flat, you're surviving on your existing base.
Format: Percentage. Trend: green-if-up.
6. Refund Rate
Operational health at a glance. Spikes here usually precede support ticket spikes by a week or two.
Format: Percentage. Trend: red-if-up. Filter by product or vendor to find the culprit.
Ready-to-build formulas
Marketing Efficiency Ratio:
Total Sales / (Facebook Ad Spend + Google Ad Spend)Contribution Margin %:
(Net Sales - Cost of Goods - Blended Ad Spend - Expenses) / Net SalesNew Customer CAC:
Blended Ad Spend / New CustomersPOAS:
(Net Sales - Cost of Goods) / Blended Ad SpendRevenue from New Customers %:
Gross Sales - New Customers / Gross SalesRefund Rate:
Total Refunds / Total Sales
Build them once, drop them into your Daily Overview, and schedule the dashboard to your inbox every morning.
Jesús Avendaño
·